API Reports: Natural Gas Production Up, But Crude Oil Remains Flat
Dean Foreman
Posted December 15, 2022
If the U.S. and global economies are on the verge of a steep recession, it has not been apparent from oil and natural gas market perspectives. That’s a takeaway from API’s latest Monthly Statistical Report (MSR™), with data through November, and API’s Industry Outlook for the fourth quarter of 2022.
Demand for oil and natural gas commodities has, in a word, remained “solid” despite recently diminished economic growth expectations by virtually every official economic source.
Amid Russia’s war in Ukraine, the pull for U.S. energy exports has never been higher, or more important for America’s allies around the world.
Key supply uncertainties that we have been monitoring – and discussing (for example, see here, here, and here) for more than 18 months – have recently made demonstrable progress for U.S. natural gas, which has seen its drilling activity surpass pre-pandemic levels and production reach new record highs. In turn, this has helped ease domestic natural gas market tightness that was evident last quarter. Internationally, a shortage has persisted as winter set in across the northern hemisphere.
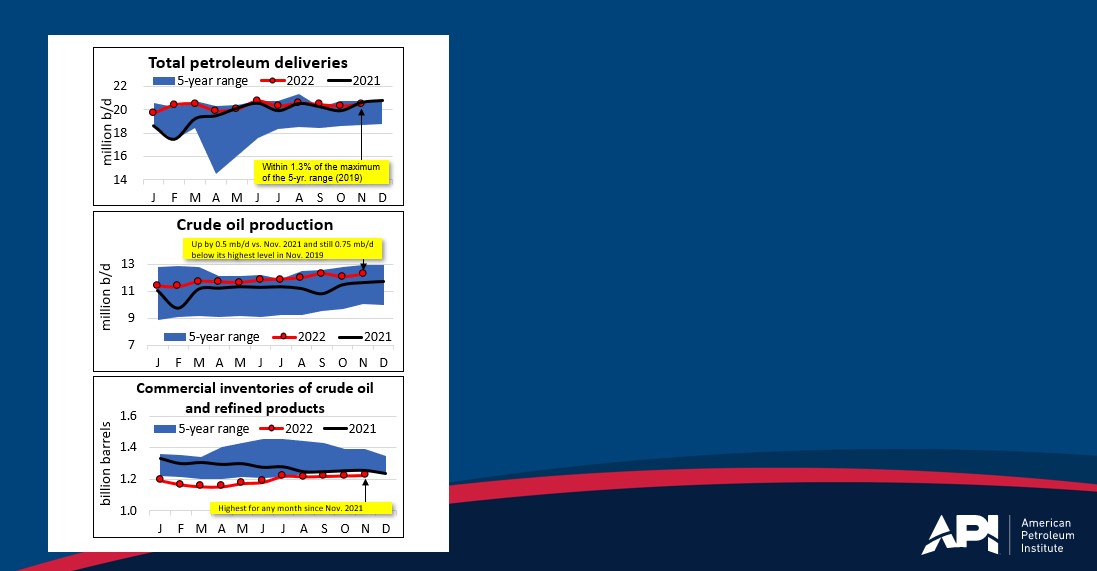
By contrast, U.S. crude oil production has remained relatively flat. Oil drilling activity picked up, but its productivity in the field fell by an average of over 20% year on year (y/y) in October compared with October 2021, per the U.S. Energy Information Administration (EIA). Consequently, greater effort is required to sustain and grow domestic production. Compared with its highest level of 13.0 million barrels per day (mb/d) in November 2019, U.S. crude oil production was at remained at 12.25 mb/d in November and 12.1 mb/d as of mid-December.
Together these fundamentals – solid petroleum demand, record-high exports and flat production – have induced the U.S. to continue relying on its petroleum inventories, which fell in total for 10 consecutive quarters through Q4 2022, per EIA.
For refined products like diesel fuel and heating oil that we discussed as being at historically low inventory levels since last summer (see here), it is potentially good news that distillate inventories recently increased towards their historical norms.
For crude oil, however, the two types of inventories – U.S. commercial/private inventories as opposed to government-controlled or Strategic Petroleum Reserves (SPR) – have taken different courses. Specifically, while commercial crude oil inventories have returned toward their five-year historical range, the SPR fell to its lowest level since February 1984. Of course, releases from the SPR could have helped support commercial inventories. But U.S. petroleum consumption through the first 11 months of 2022 was over 29% higher than it was in 1984.
Thus, the bottom line is that the lowest SPR levels in nearly 40 years could provide less security from global oil market shocks.
Let’s delve into some of the details, starting with a summary by the numbers.
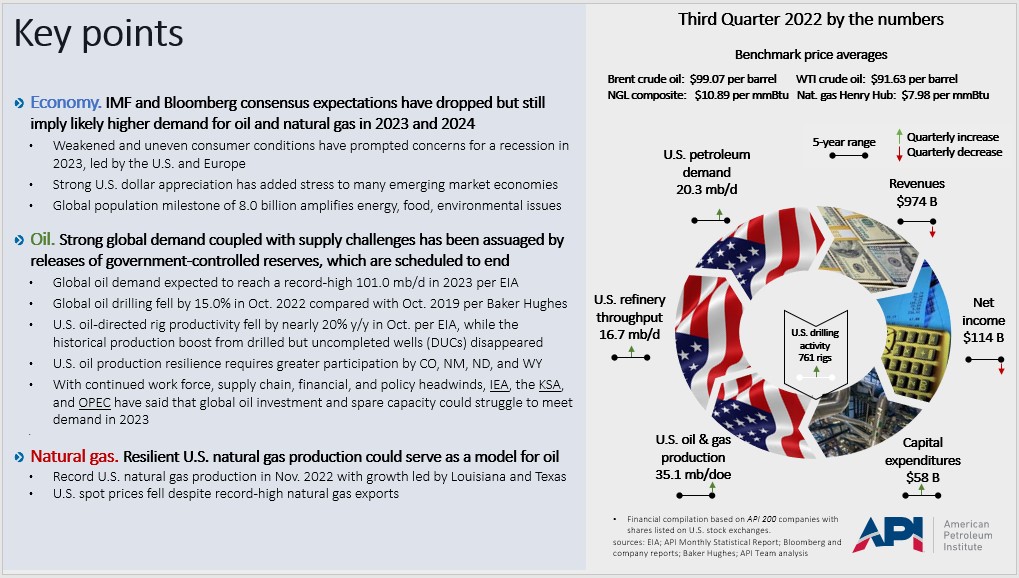
The main indicators across the industry and company performance that we monitor, as shown in the right panel, present estimates for the latest quarter for which there is complete financial reporting by publicly listed companies. The bar beneath each concept represents its five-year historical range for the third quarter of 2022, compared with the third quarter in 2017 to 2021, and the position of the arrow on the bar shows where the reading for Q3 2022 stood within its historical range.
For example, industry revenues and net income were at their highest levels in the past five years, which makes sense given that the last time crude oil prices that averaged more than $99 per barrel was in Q3 2014. A green upward arrow shows an increase between the second and third quarters, and a red downward arrow indicates a quarterly decrease.
As additional examples, U.S. petroleum demand increased between the second and third quarters and was toward the upper end of its historical range. And domestic oil and natural gas production increased for the quarter and topped its five year-range. Notably, however, natural gas drove the production figure up, as crude oil production remained below its highest levels.
The side-by-side comparison of U.S. natural gas and oil is pivotal. Natural gas production appeared to surmount the industry’s headwinds of work force, supply chain, financial, and energy policy issues. By contrast, oil production did not do so to nearly the same extent.
Why is that so? Natural gas production has boomed in Louisiana and Texas, which fostered production and have good infrastructure access. Yet, oil production growth to pre-pandemic levels has historically required broader activity in the states (drilling remained below pre-pandemic levels in Colorado, New Mexico, North Dakota and Wyoming), and it required roughly four times more nationwide drilling rig activity. U.S. oil drilling involved 627 drilling rigs as of Dec. 2, compared with only 155 rigs for natural gas production. Consequently, oil drilling has involved about four times more capital to sustain its production, which brings us next to capital investment activities.
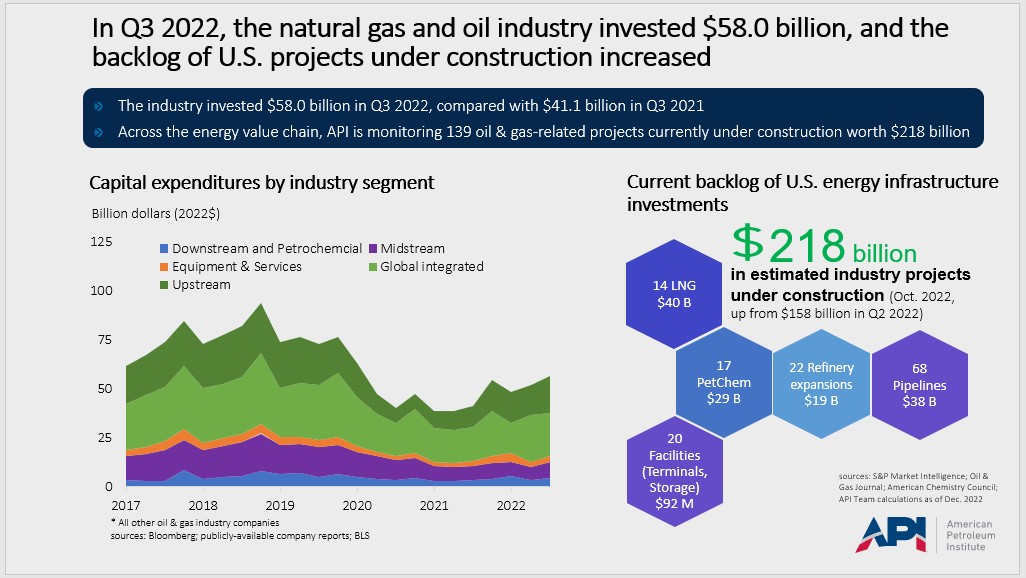
At API, we track publicly announced capital investments as a flow by company and industry segment over time as well as a backlog of projects currently under construction. In the left panel, we see that capital investment rose to $58 billion in Q3 2022 from $41.1 billion one year ago, per Bloomberg and company financial reporting the U.S. Securities and Exchange Commission. These are global companies, and the majority of capital (shaded in green) is required for upstream oil and natural gas resource developments, or by global integrated companies that have large resource development requirements. The $58 billion in Q3 2022 reflected a 41.1% y/y rise.
Not all of this was a real spending increase, however, since price inflation for oil services escalated. For example, the U.S. Bureau of Labor Statistics (BLS) reported oil and natural gas extraction price inflation of 47% y/y for September 2022. As shown in the right panel, the backlog of U.S. oil and natural gas projects under construction stood at $218 billion in Q3 2022, up from $158 billion last quarter, so investments increased through the value chain.
Drilling activity has historically followed oil prices, compared as follows based on Baker Hughes’ rig counts compared with international Brent crude oil futures prices.
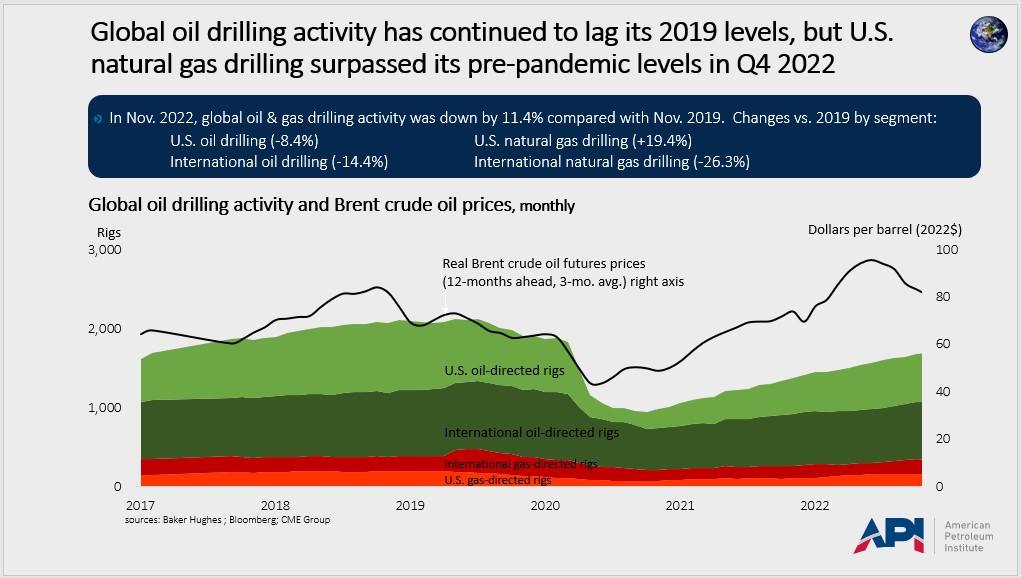
Domestic natural gas drilling was 19.4% above its level in November 2019, which is why U.S. natural gas production has achieved new record highs of dry natural gas production over 100 billion cubic feet per day, per EIA. Oil drilling has also picked up this year but lagged its pre-pandemic levels domestically and internationally.
Even more oil drilling and production could be needed, according to official estimates from EIA and the International Energy Agency (IEA), despite expectations for slower economic growth in 2023.
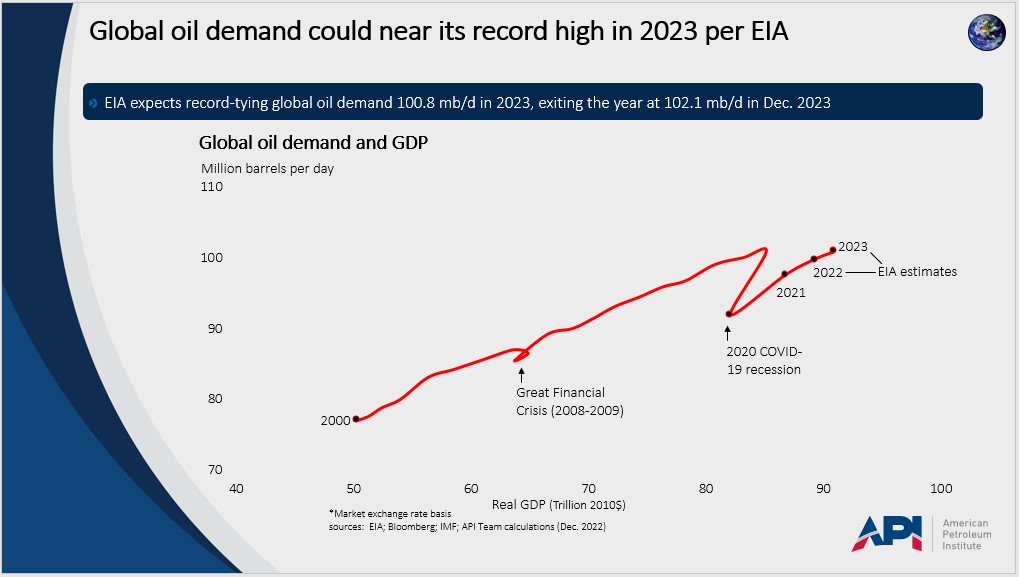
The amount of global oil demand is on the vertical axis, compared with the size of the global economy on the horizontal axis. The relationship between the economy and oil demand was consistent over the past 20 years, until the 2020 COVID-19 recession. The recovery since then shows that oil demand could tie its record high of 100.8 mb/d in 2023 per EIA, despite potentially slower economic growth.
For the United States, a snapshot of the domestic demand for petroleum fuels follows, with colors matched with high-frequency activity indicators by industry segment.
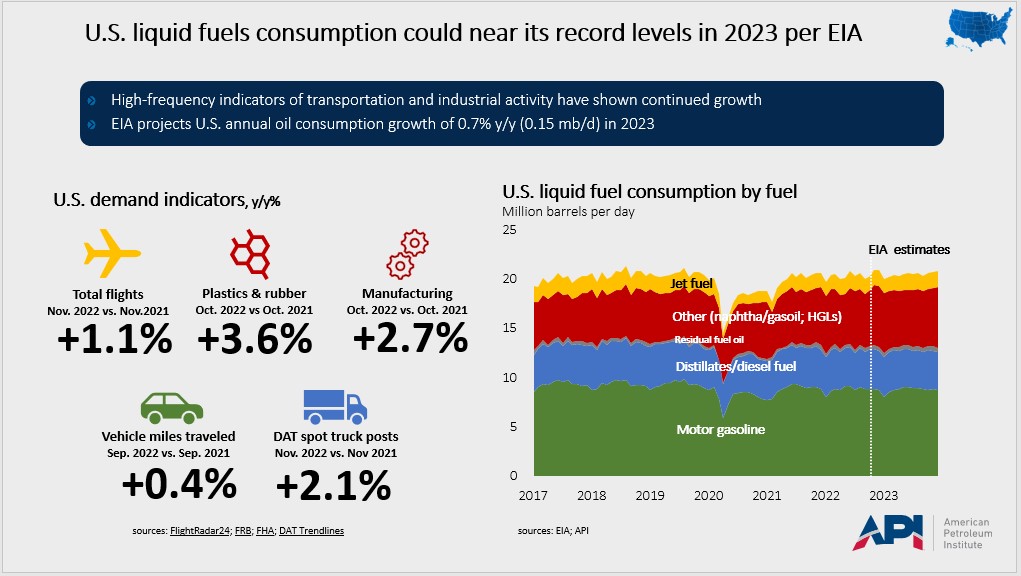
Regardless of whether recession may be coming, EIA’s demand estimates suggest the U.S. economy has continued requiring petroleum-based fuels for essential transportation, freight, air travel, and manufacturing.
And this also is supported by API’s industry data for November, which showed total petroleum demand within 1.3% of the maximum of its five-year range. The data also reinforced that domestic crude oil production continued to trail its highest levels by 0.75 mb/d and that, consequently, U.S. combined crude oil and refined product inventories have picked up but remained below their historical five-year range.
Focusing next on U.S. crude oil inventories, we see that commercial holdings and those in the government-controlled strategic petroleum reserves (SPR) plotted different courses over the first 11 months of the year.
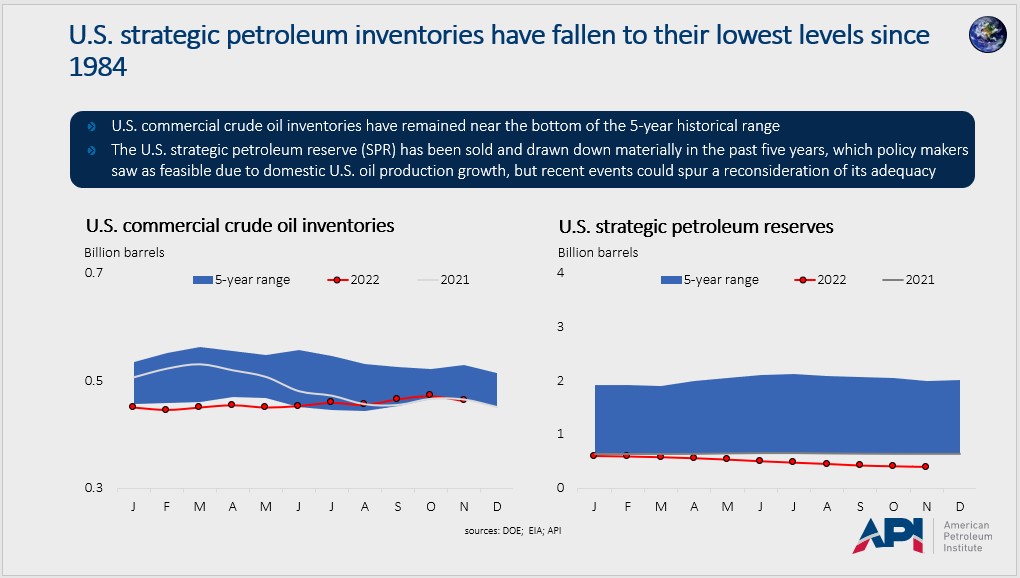
Commercial crude oil inventories that fell below their historical norms in the first half of the year but ended up just 4.0 million barrels below their January level.
By contrast, SPR releases of over 206 million barrels (0.6 mb/d) or nearly one third of SPR inventories year-to-date through Dec. 2 have left the SPR at its lowest level since February 1984. Commercial inventories could have been supported in part by the SPR releases, so a question for policymakers is whether the SPR level is adequate given the fundamentals that we have discussed. To this point, the Department of Energy announced plans to replenish the SPR by fiscal year 2023, but doing so to any significant extent also would effectively add to global oil demand at a time when EIA suggests demand could already be at a record high.
Last but not least, API’s proprietary economic indicator, the Distillate Economic Indicator™, has continued to suggest that U.S. industrial production and broader economic activities have grown.
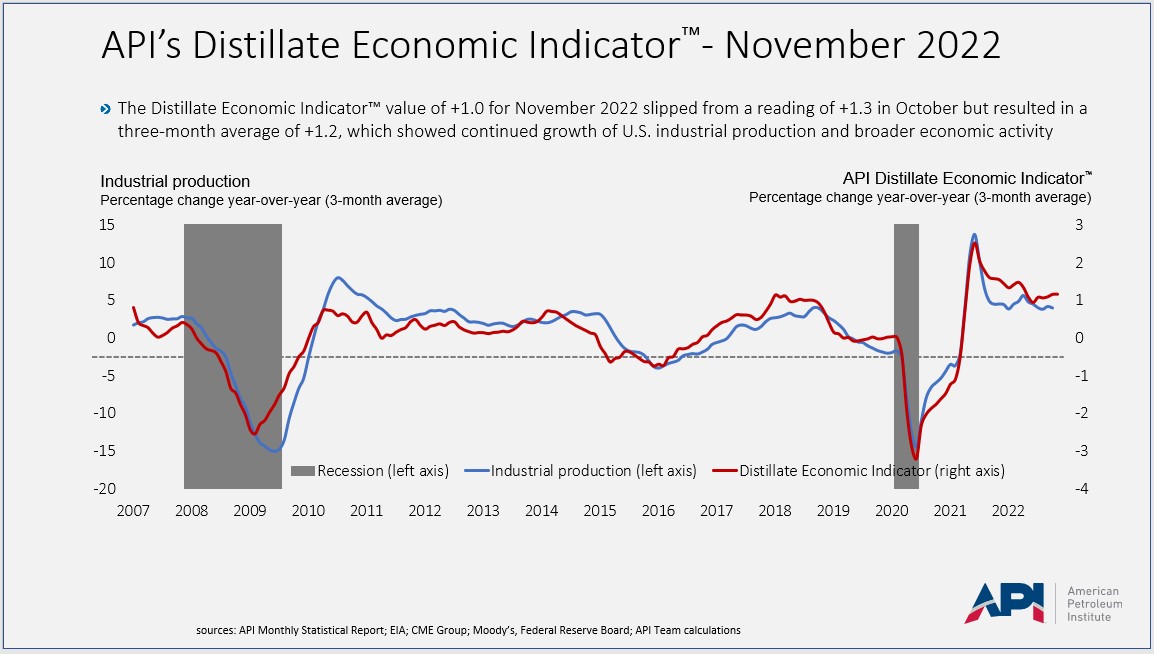
All in all, the key implication of the API reports is that although expectations for the economy have weakened, the world’s energy needs are likely to grow.
This may not provide the same degree of energy abundance and security that American consumers have come to expect throughout the shale revolution over the past decade, which underscores why cogent and responsible energy policies supporting broader production and supporting infrastructure remain essential.
About The Author
Dr. R. Dean Foreman is API’s chief economist and an expert in the economics and markets for oil, natural gas and power with more than two decades of industry experience including ExxonMobil, Talisman Energy, Sasol, and Saudi Aramco in forecasting & market analysis, corporate strategic planning, and finance/risk management. He is known for knowledge of energy markets, applying advanced analytics to assess risk in these markets, and clearly and effectively communicating with management, policy makers and the media.


