


MSR: Weaker Petroleum Demand, Stronger Supply, Yet Lower July Inventories

Dean Foreman
Posted August 18, 2022
API’s new Monthly Statistical Report (MSR™), with primary data through July, showed petroleum demand and supply responses to recent high prices while also highlighting a potential misreading of the state of U.S. crude oil inventories. Highlights:
- U.S. petroleum demand of 19.8 million barrels per day (mb/d) in July fell from June as well as the same month a year ago, with broad decreases among transportation fuels amid historically high prices.
- U.S. refining (gross inputs 16.7 mb/d; 93% capacity utilization rate) sustained consecutive months of historically strong activity levels.
- Domestic crude oil production slipped from June but remained at its highest for the month of July on record since 1920. Natural gas liquids (NGL) production rose to a record 6.0 mb/d for any month on record.
- Driven by record-high total petroleum exports of 9.6 mb/d, the U.S. was a petroleum net exporter of 1.0 mb/d in July.
- Combined commercial and strategic petroleum reserves of crude oil fell to their lowest level since 2004.
The headline figures in July were the new record-high levels of NGL production (6.0 mb/d) and U.S. petroleum exports (9.6 mb/d). The record pull for exports coincided with domestic oil prices having fallen more than $10 per barrel below international ones, twice their average difference through the first half of 2022.
Meanwhile, despite oil prices that were over $100 per barrel in July, U.S. crude oil production decreased from June at the same time as the demand for motor fuels downshifted, one month removed from the highest nominal U.S. fuel prices.
These developments resulted in a slight increase in U.S. commercial crude oil inventories. However, this was offset by decreases nearly five times larger in U.S. Strategic Petroleum Reserve (SPR) crude oil holdings. Consequently, U.S. total crude oil inventories fell to their lowest level since 2004.
In fact, current oil market prices may reflect diminished economic expectations and the possibility of a recession. They’ve also seen U.S. Energy Information Administration (EIA) data that commercial crude inventories rose in July – though levels remained below the historical five-year average.
New for markets to process have been unprecedented Strategic Petroleum Reserve (SPR) releases of 1.0 million barrels per day over the past six months. Notably, SPR’s release in July was nearly five times larger than the increase in commercial inventories, suggesting that without the oil from the SPR the market might have struggled to meet demand. Additional domestic production could help address near- and long-term demand/supply imbalances.
U.S. oil drilling activity in July remained 22.9% below where it was in July 2019, which is why there remained a gap of 1.0 mb/d of domestic crude oil production in July compared with its highest levels in late 2019 and early 2020.
Let’s dig into some of the key charts and data from July.
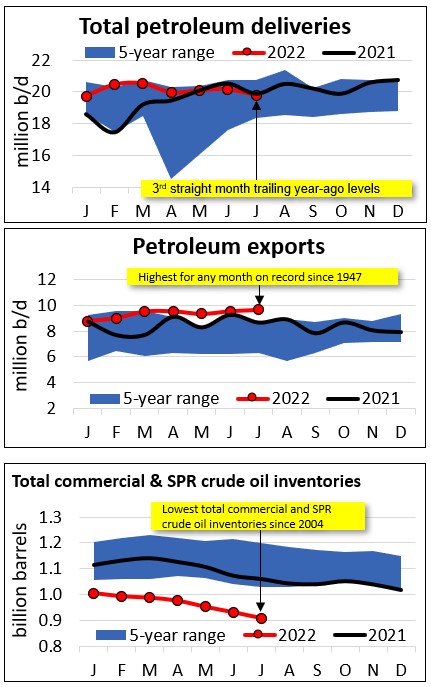
U.S. petroleum demand, as measured by total domestic petroleum deliveries, was 19.8 mb/d in July. This reflected a seasonal decrease of 1.9% from June and also was down by 0.6% year-on-year (y/y) compared with July 2021. This was the third straight month in which demand trailed its year-ago levels. However, demand through the first seven months of the year remained up by 4.0% y/y versus the same period a year ago.
U.S. petroleum exports – crude oil and refined products – of 9.6 mb/d in July were the highest on record for any month since 1947. Combined with a 1.4% month-on-month (m/m) decrease in petroleum imports, the U.S. was a petroleum net exporter of 1.0 mb/d in July and averaged net exports of 0.9 mb/d through the first seven months of 2022.
U.S. crude oil inventories rose by 1.3% m/m from June but were down 2.4% y/y vs. July 2021 to 428.4 million barrels, the lowest for the month since 2018. Total crude oil inventories, including the SPR, however, fell by 2.4% m/m and 14.3% y/y to their lowest level since 2004.
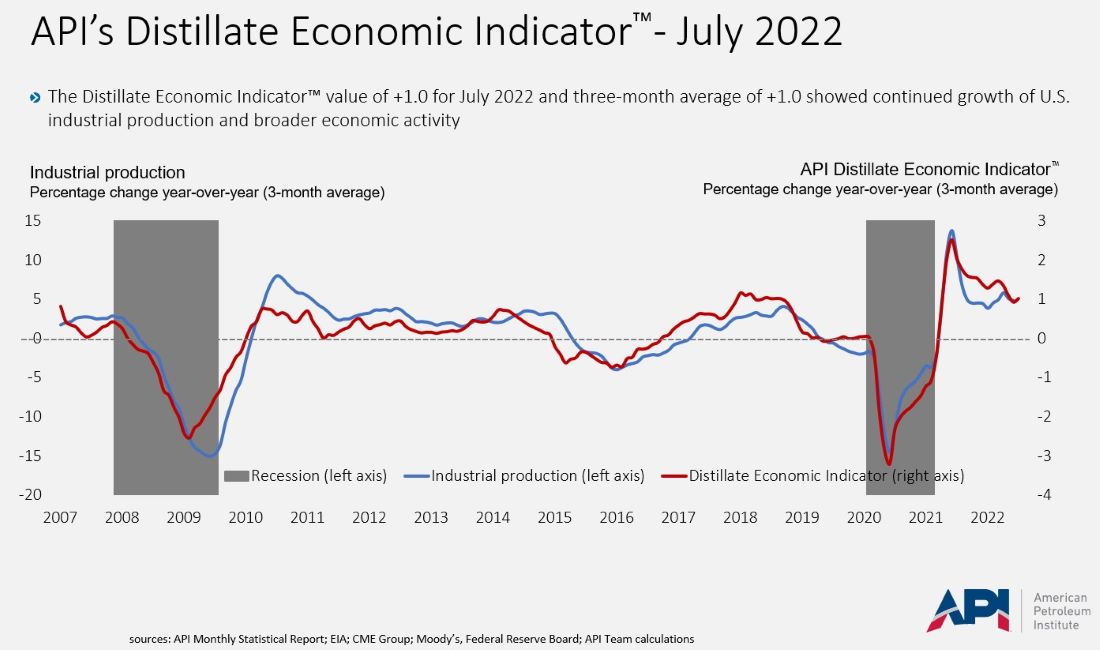
Leading indicators showed weaker industrial growth and consumer sentiment. API’s Distillate Economic Indicator™ suggested growth of U.S. industrial production and broader economic activity continued. The University of Michigan’s consumer sentiment index rose to 55.1 in early July from readings of 51.1 in July and 50.0 in June. The improvement arose from lower price inflation expectations, due in part to lower energy prices.
Overall, the July data revealed the results of supply and demand responses through inventory changes, and the net result was that the market was short of supply – except for the SPR release.
Please see the latest API MSR™ for details, product-level analysis, and data.
About The Author
Dr. R. Dean Foreman is API’s chief economist and an expert in the economics and markets for oil, natural gas and power with more than two decades of industry experience including ExxonMobil, Talisman Energy, Sasol, and Saudi Aramco in forecasting & market analysis, corporate strategic planning, and finance/risk management. He is known for knowledge of energy markets, applying advanced analytics to assess risk in these markets, and clearly and effectively communicating with management, policy makers and the media.